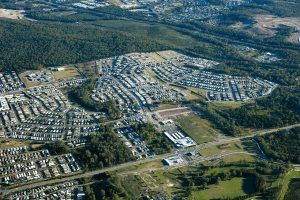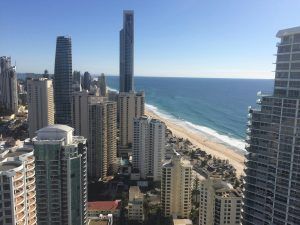
If you’re sick of reading “best suburb” lists built on gut feelings and personal bias, this article is for you. Every suburb ranked here has been scored across four metrics: rental yield, one-year capital growth, five-year average capital growth, and median days on market. We pulled the figures from our 2026 COAST Property Report, which draws on recent settlement data, CoreLogic benchmarks, and our own transaction history across the Gold Coast.
If you’re an investor at the 30-to-60-day mark on a decision — comparing markets, testing assumptions, trying to figure out whether yield or growth should drive your strategy — this is the reference you need.
Our methodology
Each suburb in our 2026 report was scored across four data points:
- Gross rental yield — the annual rental income expressed as a percentage of the purchase price. Higher is better for cashflow investors.
- One-year capital growth — the percentage change in median sale price over the 12 months to December 2025. A short-term signal of current momentum.
- Five-year average capital growth — the compound annual growth rate over five years. Smooths out noise and reflects structural demand.
- Median days on market — how quickly properties are selling. Tighter days on market signal strong buyer demand and lower vacancy risk.
Each metric was weighted equally for the overall ranking. Suburbs with strong yield but weak growth rank lower than suburbs with balanced performance across all four. Where a suburb excels in a specific dimension, we’ve highlighted it in the category sections below.
Top 10 Gold Coast suburbs for investors overall (2026)
These suburbs produced the most consistent combined scores across all four metrics.
| Rank | Suburb | Type | Gross Yield | 1yr Growth | 5yr Avg Growth | Median DOM |
|---|---|---|---|---|---|---|
| 1 | Ashmore | Units | 5.2% | 8.1% | 6.4% | 18 days |
| 2 | Mermaid Beach | Houses | 4.3% | 32.0% | 9.2% | 14 days |
| 3 | Molendinar | Units | 5.1% | 7.4% | 5.9% | 22 days |
| 4 | Merrimac | Units | 5.1% | 6.8% | 5.7% | 24 days |
| 5 | Maudsland | Houses | 4.1% | 19.0% | 7.8% | 19 days |
| 6 | Broadbeach Waters | Houses | 4.0% | 15.0% | 8.1% | 16 days |
| 7 | Southport | Units | 4.8% | 9.3% | 6.1% | 21 days |
| 8 | Burleigh Heads | Houses | 3.9% | 11.4% | 8.6% | 17 days |
| 9 | Coomera | Houses | 4.2% | 10.7% | 7.3% | 23 days |
| 10 | Labrador | Units | 4.6% | 8.9% | 5.8% | 26 days |
Source: COAST Buyer’s Agency 2026 Property Report. Settlement data to December 2025.
Two clear patterns emerge from the top ten. First, the strongest cashflow positions are concentrated in the mid-corridor suburbs — Ashmore, Molendinar, and Merrimac — where median entry prices remain accessible and rental demand is consistently strong. Second, the highest capital growth is clustered along the coastal strip and in growth corridors to the north and west, where supply constraints and lifestyle demand are compressing inventory.
Best suburbs for cashflow (yield-weighted)
If your primary investment goal is income — covering holding costs, improving serviceability for future purchases, or building a cashflow-positive portfolio — these suburbs lead the field.
- Ashmore tops the yield table at 5.2% for units. Median unit prices in Ashmore sit below the Gold Coast average, keeping entry costs manageable while rental demand remains steady, thanks to its proximity to Griffith University, the Gold Coast Private Hospital precinct, and the Southport CBD. Vacancy rates have been consistently tight.
- Molendinar (5.1%) and Merrimac (5.1%) are functionally similar markets — both inner-western suburbs with strong unit fundamentals, owner-occupier stability, and above-average rental absorption. These aren’t glamorous suburbs, and that’s precisely why the yields hold. Competition from lifestyle buyers is lower, and rental demand from healthcare, education, and retail workers in the corridor is reliable.
- Southport (4.8%) is the highest-yield suburb on the coastal strip itself. It’s a broader market than the others on this list — more supply, more price variance — but the unit sector specifically continues to deliver above-average income returns. Development risk is worth monitoring, but short-term rental demand from workers in the health precinct and legal district provides a buffer.
For investors who want a yield above 4.5%, units in these four suburbs are the clearest data-backed options on the Gold Coast right now.
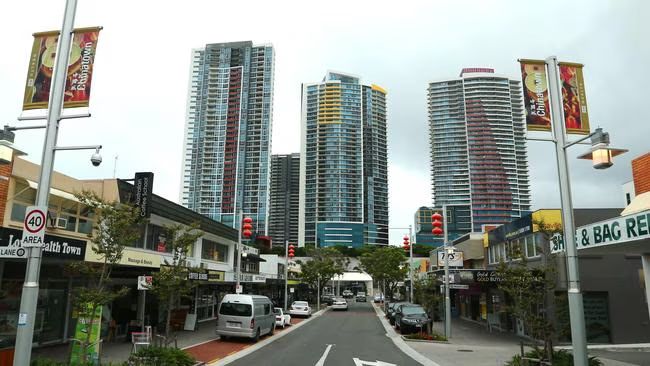
Photo of Davenport St Southport, Gold Coast
Best suburbs for capital growth
For investors prioritising long-term wealth accumulation over immediate income, these suburbs are where the Gold Coast’s structural growth story is playing out most clearly.
- Mermaid Beach recorded one-year house price growth of 32% — the strongest single-year result in our report. That figure reflects a sustained period of demand compression in one of the most supply-constrained coastal precincts on the East Coast. New stock is virtually nonexistent, interstate migration has reinforced the buyer pool, and owner-occupier demand consistently outpaces investment sales. The five-year compound annual growth rate of 9.2% is among the highest in the region.
- Maudsland (19% one-year, 7.8% five-year CAGR) is the growth story further west. Located in the northern hinterland growth corridor, Maudsland has seen strong demand from families priced out of coastal markets who are willing to trade proximity to the beach for land size and lifestyle amenity. Infrastructure investment around the northern corridor — particularly the Coomera Connector — is supporting medium-term capital expectations.
- Broadbeach Waters (15% one-year, 8.1% five-year CAGR) bridges the gap between coastal prestige and investment fundamentals. Canal and waterfront homes here carry genuine scarcity value. Days on market are extremely tight at 16 days, which is a proxy for how quickly competition resolves in this market. The five-year average growth rate indicates this isn’t a short-term spike.
If your investment horizon is five-plus years and you can hold through any short-term rate-cycle softness, these three suburbs represent the Gold Coast’s strongest structural capital growth case.
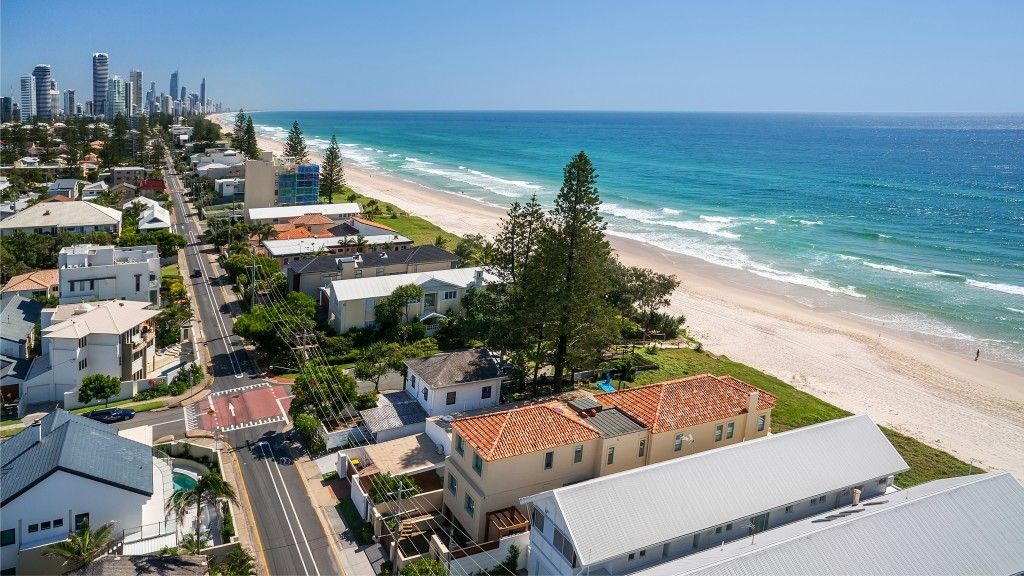
Photo of Hedges Avenue in Mermaid Beach, Gold Coast
Best suburbs for balanced returns
Not every investor wants to optimise exclusively for yield or growth. If you’re building a portfolio designed to be both serviceable and appreciating over time, these suburbs offer the most balanced return profile in our data.
- Coomera continues to demonstrate that the northern growth corridor is maturing, not speculating. Yields above 4% are supported by population growth driven by new school catchments, infrastructure investment, and an expanding healthcare and retail precinct. Capital growth of 10.7% year-on-year reflects genuine demand, not FOMO. The five-year CAGR of 7.3% gives confidence that the growth is structural.
- Burleigh Heads (3.9% yield, 11.4% one-year growth, 8.6% five-year CAGR) is arguably the Gold Coast’s most complete suburb from an investment fundamentals perspective. It’s lifestyle-driven, supply-constrained, and consistently attracts both owner-occupiers and investors, thereby tightening the market and supporting values. A days-on-market of 17 reflects how quickly the market clears. Yield is the trade-off; if you’re comfortable with sub-4%, the capital case is compelling.
- Southport units also appear here — the 4.8% yield combined with 9.3% one-year growth makes them a legitimate balanced-return option, particularly for investors who want exposure to the CBD precinct without paying coastal premiums.
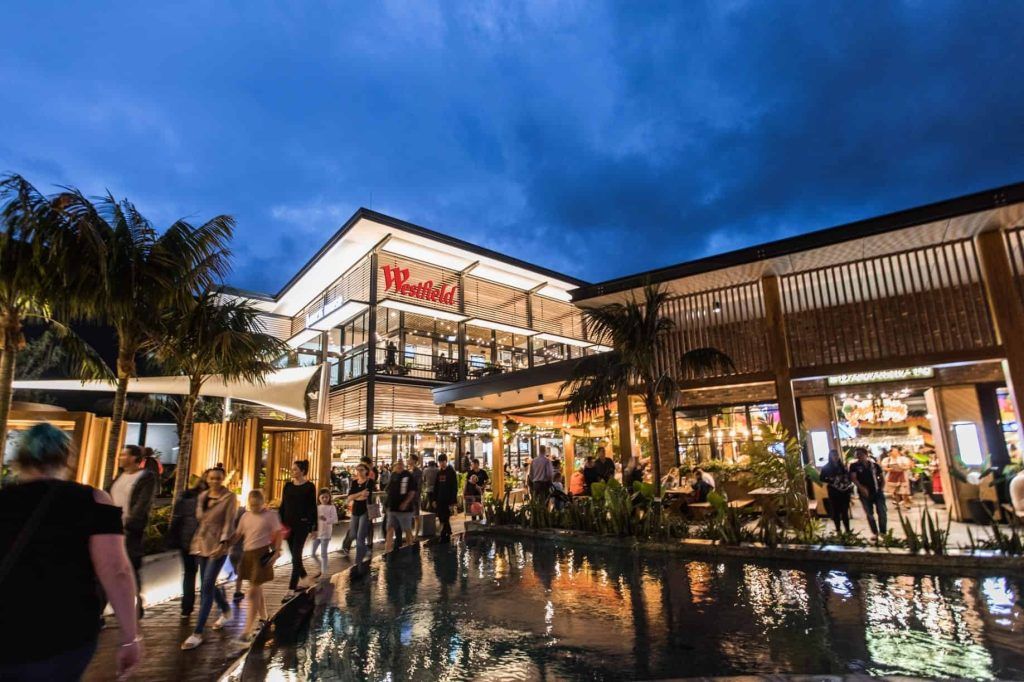
Westfield Coomera
Fast-selling markets: where demand is highest
Days on market is one of the most underused metrics in property research. It tells you how quickly buyer competition resolves, which in turn indicates vacancy risk, future price direction, and how hard it is to resell.
The fastest-moving markets in our 2026 report:
Suburb | Property Type | Median Days on Market |
|---|---|---|
Mermaid Beach | Houses | 14 days |
Broadbeach Waters | Houses | 16 days |
Burleigh Heads | Houses | 17 days |
Ashmore | Units | 18 days |
Maudsland | Houses | 19 days |
A sub-20-day DOM in any Gold Coast market is a meaningful signal. It indicates that properties are receiving offers before the first week of open homes concludes, and that vendors are not reducing to meet the market — buyers are moving to meet vendors.
For investors, fast-selling markets reduce resale risk and, particularly for those purchasing with a medium-term hold period, offer more flexibility should circumstances change.
The booming suburbs: what's growing fastest right now
“Booming” is a term that gets applied loosely in property commentary. For the purposes of this report, a booming suburb is one where one-year price growth significantly exceeds both the Gold Coast average and the suburb’s own five-year trend — indicating a market in active uplift rather than steady appreciation.
By that measure, three suburbs stand out clearly.
- Mermaid Beach is the most obvious. A 32% one-year growth figure is extraordinary by any standard and represents a genuine repricing of what coastal prestige commands in a post-pandemic market with constrained supply.
- Maudsland at 19% reflects the strong northward migration of families seeking land and space, supported by infrastructure investment in the Coomera and northern corridors. This isn’t a new story, but the pace of appreciation has accelerated.
- Broadbeach Waters, at 15%, sits at the intersection of demand for canal lifestyle and proximity to the entertainment and hospitality precinct around Broadbeach. The suburb has consistently outperformed Gold Coast house price averages over the five-year cycle and shows no signs of cooling.
If you’re in research mode and wondering which markets have the most current momentum, these three are the honest answer. The caveat is that fast appreciation compresses yields, which is why they appear lower in the yield table than they do here.
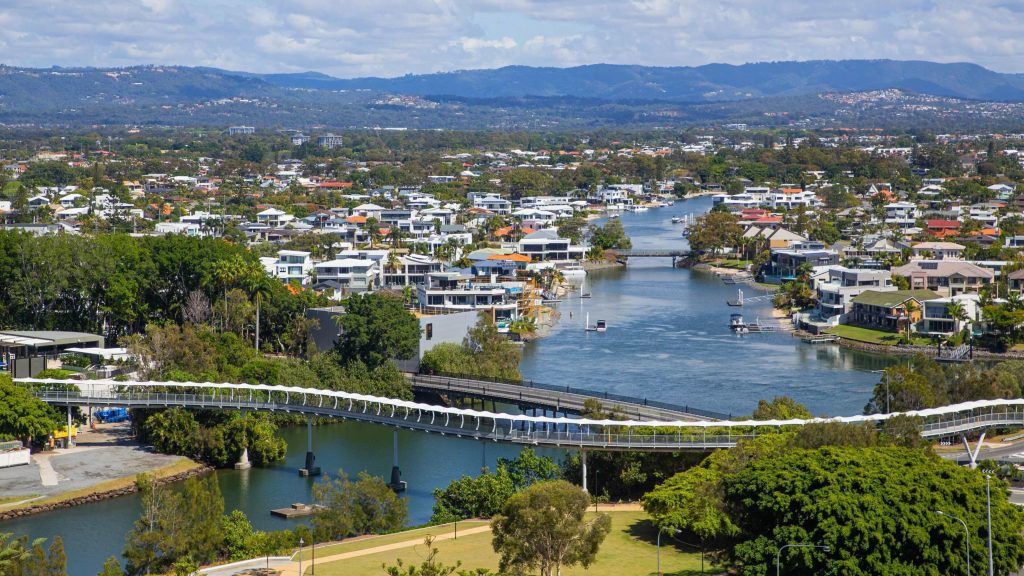
Broadbeach Waters, QLD
What the data can't tell you
Ranked lists create an illusion of certainty that the property market doesn’t fully support. There are things the numbers in this report — or any report — don’t capture.
Individual property condition, body corporate health for units, and block orientation all materially affect real-world returns in ways that median data smooths over. Street-level supply pipeline (new unit approvals, development applications) can change a suburb’s rental yield story faster than annual data reflects. And tax structure, borrowing capacity, and holding strategy mean that the best suburb on the Gold Coast for one investor may be the wrong choice for another.
This data is the right starting point. It narrows a field of 100-plus Gold Coast suburbs to the ten or fifteen that deserve serious attention. What it can’t do is replace a site visit, a portfolio conversation, and a due diligence process on a specific property.
Want the full ranked list?
This article features the highlights from our 2026 COAST Property Report — the full report includes complete performance tables for houses and units across 40+ Gold Coast suburbs, including median prices, transaction volumes, yield benchmarks, and our own commentary on each market.
If you’d like a copy of the report or want to talk through how the data applies to your investment strategy, get in touch with our team. We work with investors across the country who are making purchasing decisions on the Gold Coast — and we’re familiar with the questions that data alone doesn’t answer.
Data sourced from the COAST Buyer’s Agency 2026 Property Report. Settlement data to December 2025. Past performance is not a reliable indicator of future results. This article is for general information purposes only and does not constitute financial or investment advice.